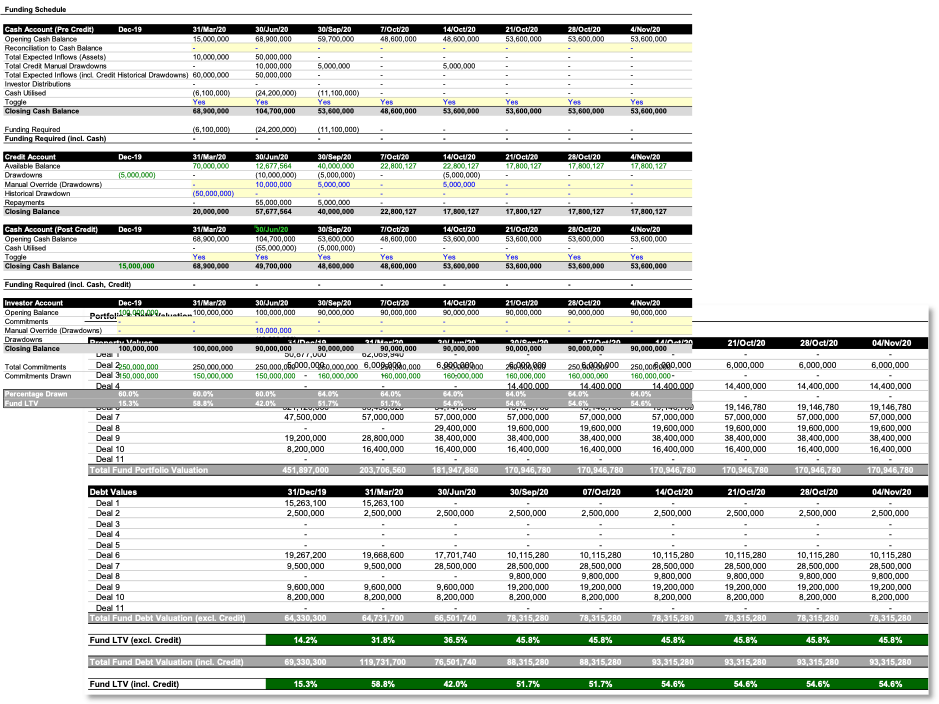
The client, a Real Estate Private Equity firm, wanted the TresVista Team to build a model to forecast drawdowns for the fund and the credit line that would allow overriding manually, particularly for historical repayments of the credit line and unaccounted investor drawdowns. The client wanted to track and measure the impact of new deals on the fund LTV to ensure that it did not cross the limit of 65%.
To build a model to monitor fund expenses and determine the funding source for these expenses while maintaining certain fund covenants around cash, investor drawdowns, or the credit line with the bank.
The TresVista Team followed the following process:
The major hurdles faced by the TresVista Team were:
The team added a circular reference breaker and built two cash account schedules to tackle the issue generated by circular references. To deal with the periodic nature of the credit tracker, the team built a separate weekly cash flow on top of the quarterly cash flow that came from the client’s larger fund model. This new cash flow spread the quarterly amount equally across the weeks.
The TresVista Team created a dashboard containing charts that allowed the client to get a quick snapshot of the model and how levered they were. The dynamic chart showed the deal level expenses and the information about the source which was used to fund them. It also provided the functionality to view charts for different quarters and years. The combo charts depicted the facility available, investor drawdown, and fund LTV. Sources of funds were represented using a stacked chart, and a line chart was used to portray the LTV and headroom on LTV.