The client wanted the TresVista team to set up data-driven consumer survey templates which allowed for performing faster analysis & create outputs for the same in the form of dashboards. The client asked the team to build a template for a survey conducted by the client in Germany on Health Nutrition & Supplements category. The team was given a set of questions and possible options/answers for the responders to choose from and was asked by the client to include filters such as age, gender, and income bracket while creating the template for the charts.
The objective was to set up data-driven consumer survey templates to perform Consumer Sentiment Analysis on products and brands using effective dashboards.
The TresVista team followed the following process:
The major hurdle faced by the TresVista team was to process the raw data file to create various templates for analyzing the data.
The TresVista team overcame this hurdle by creating a dynamic dashboard to represent the raw data in the desired manner and presenting various dashboards created in the output file using different filters. Additionally, the team imbibed new and unique ways of setting up the templates to create charts like Box & Whiskers and Van Westendorp.
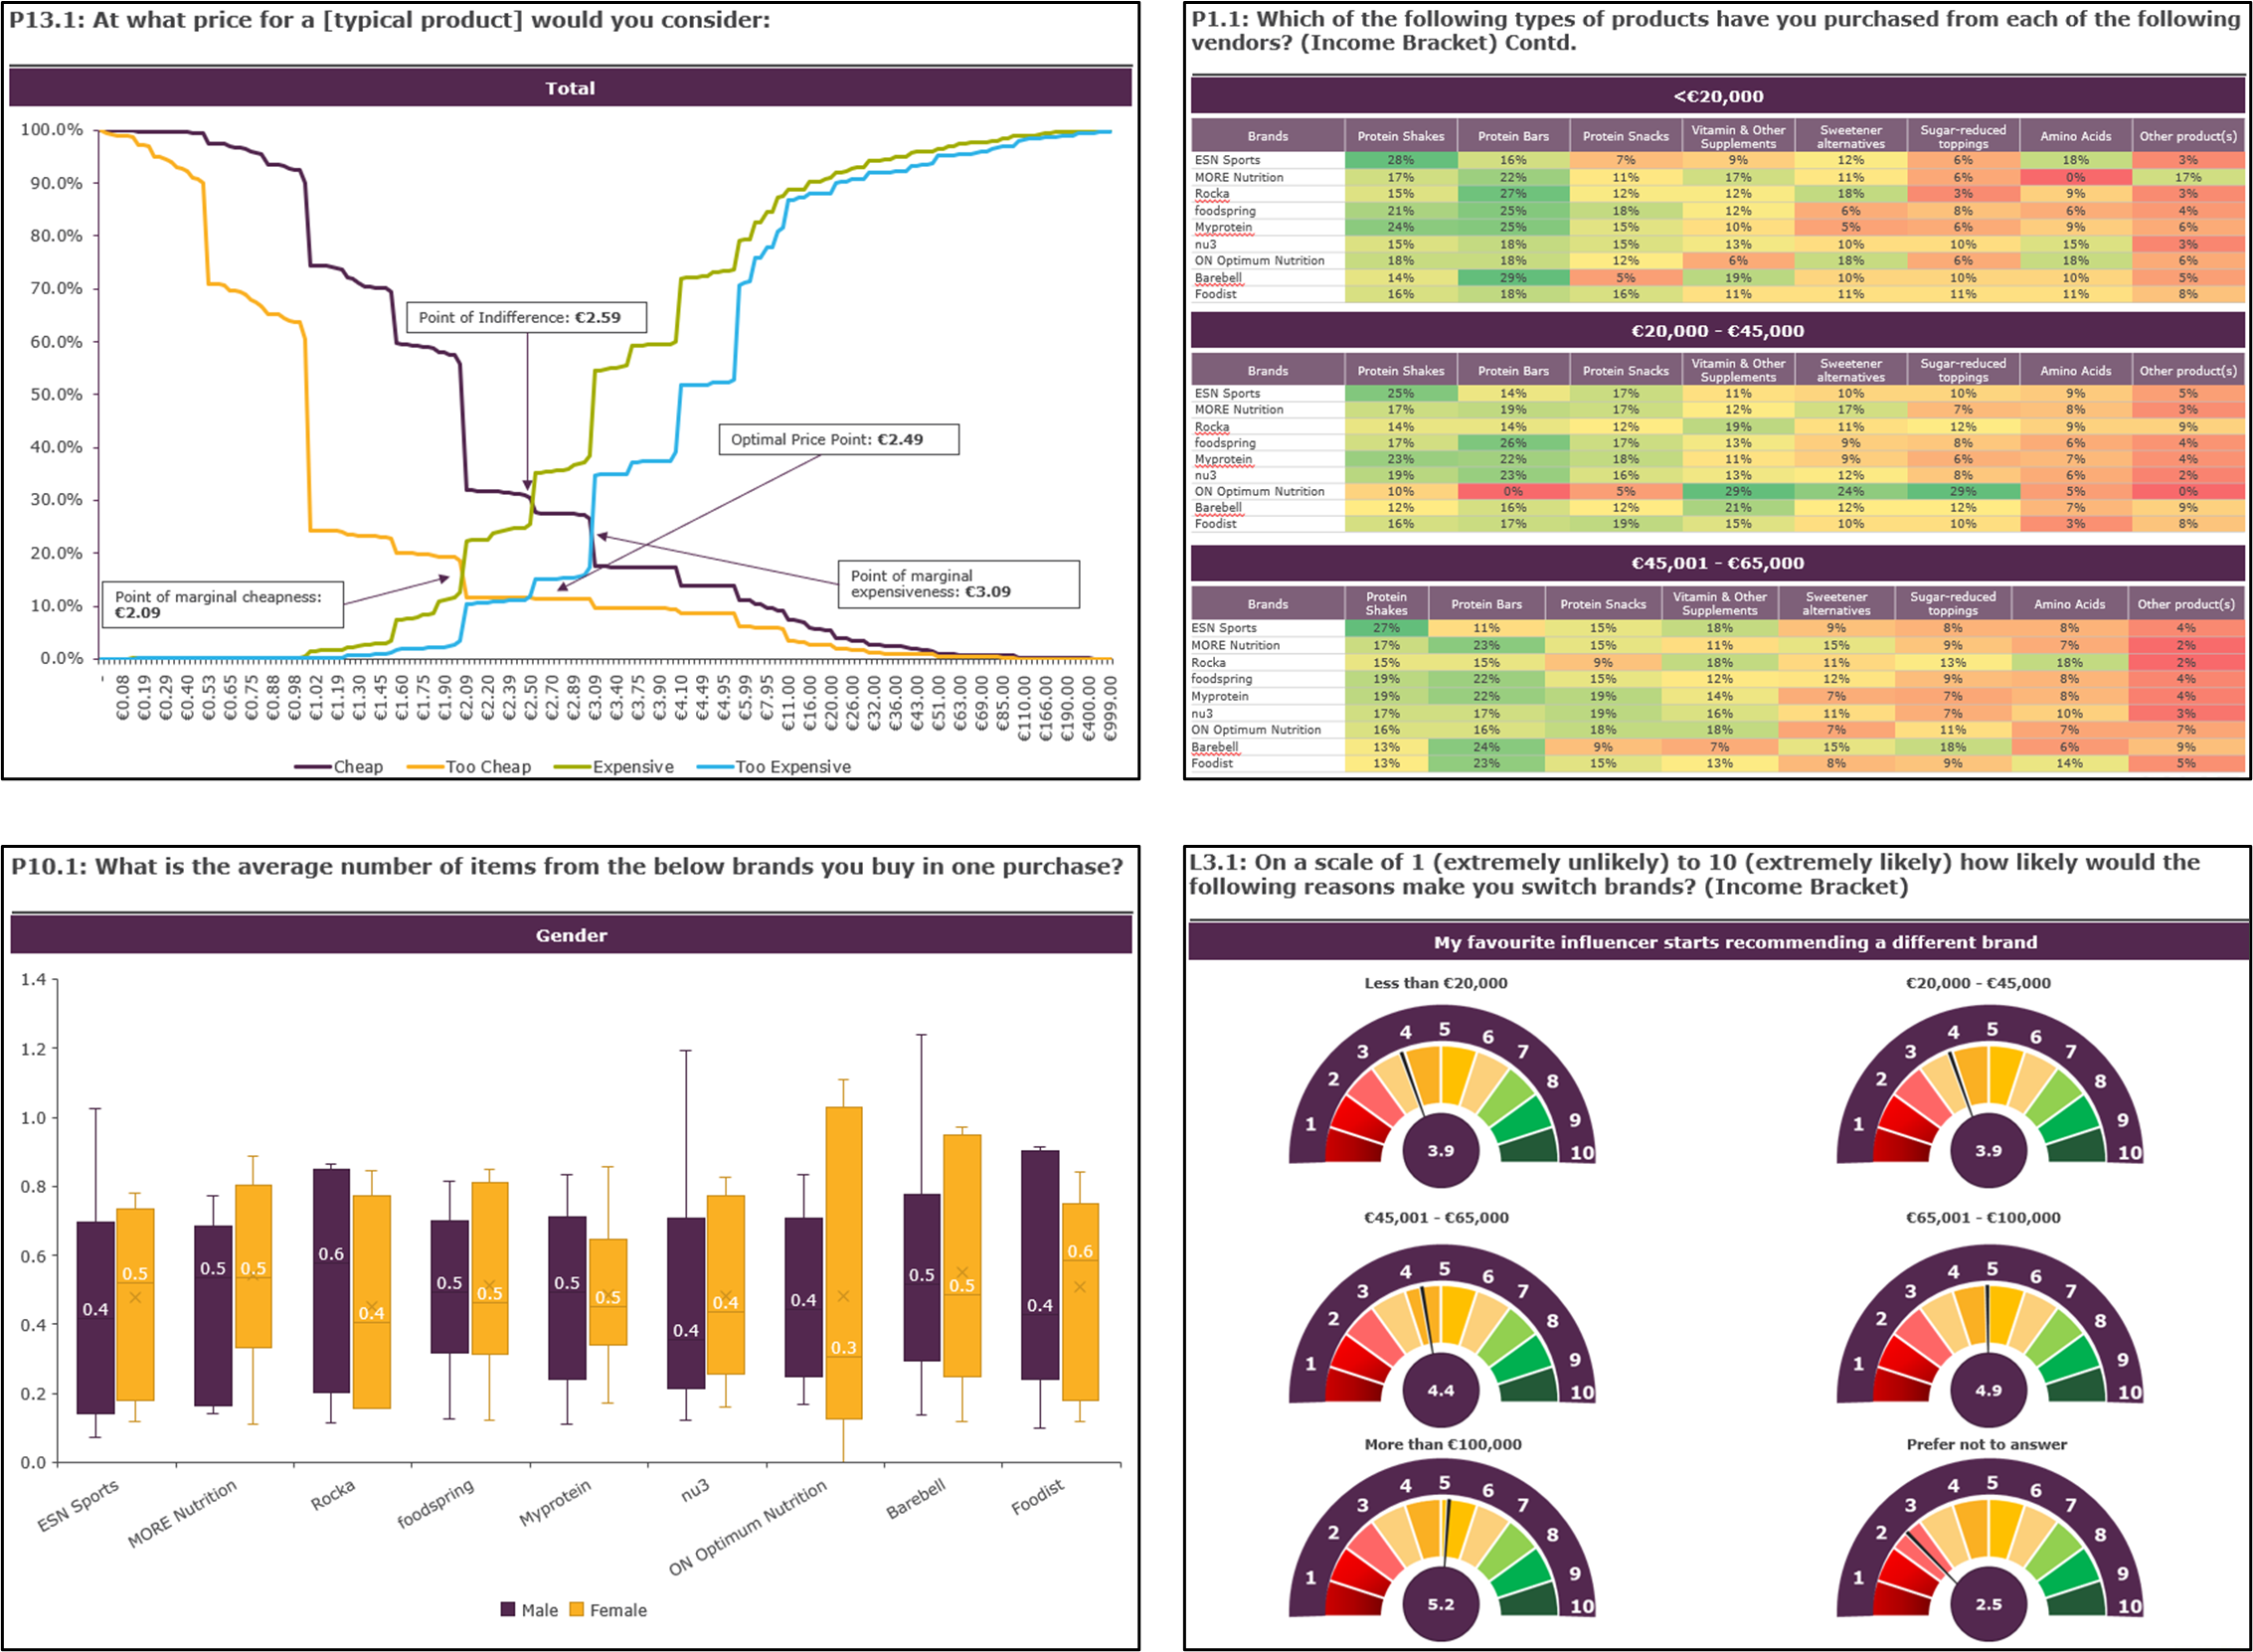
The TresVista team created a dynamic dashboard to represent the raw data in the desired manner and converted qualitative consumer preferences into quantifiable and measurable outputs. The team also automated the data processing and data integration with the dashboard for any additional number of results, while visualising the data using charts like Box & Whiskers and Van Westendorp.