
The Context
The client, a Private Equity firm in the restaurant franchise business, asked the TresVista team to prepare a comprehensive dashboard to evaluate and analyze the performance trends of multiple stores that the client invests in. Additionally, they wanted the dashboard to serve as a tool for updating store-level financial data periodically.
The Objective
To prepare a comprehensive dashboard to evaluate and analyze the performance trends of multiple stores that the client invests in.
The Approach
The TresVista team followed the following process:
• Consolidated financial data from over 50-60 stores across 13 financial periods into a single tab, creating a unified data source for analysis
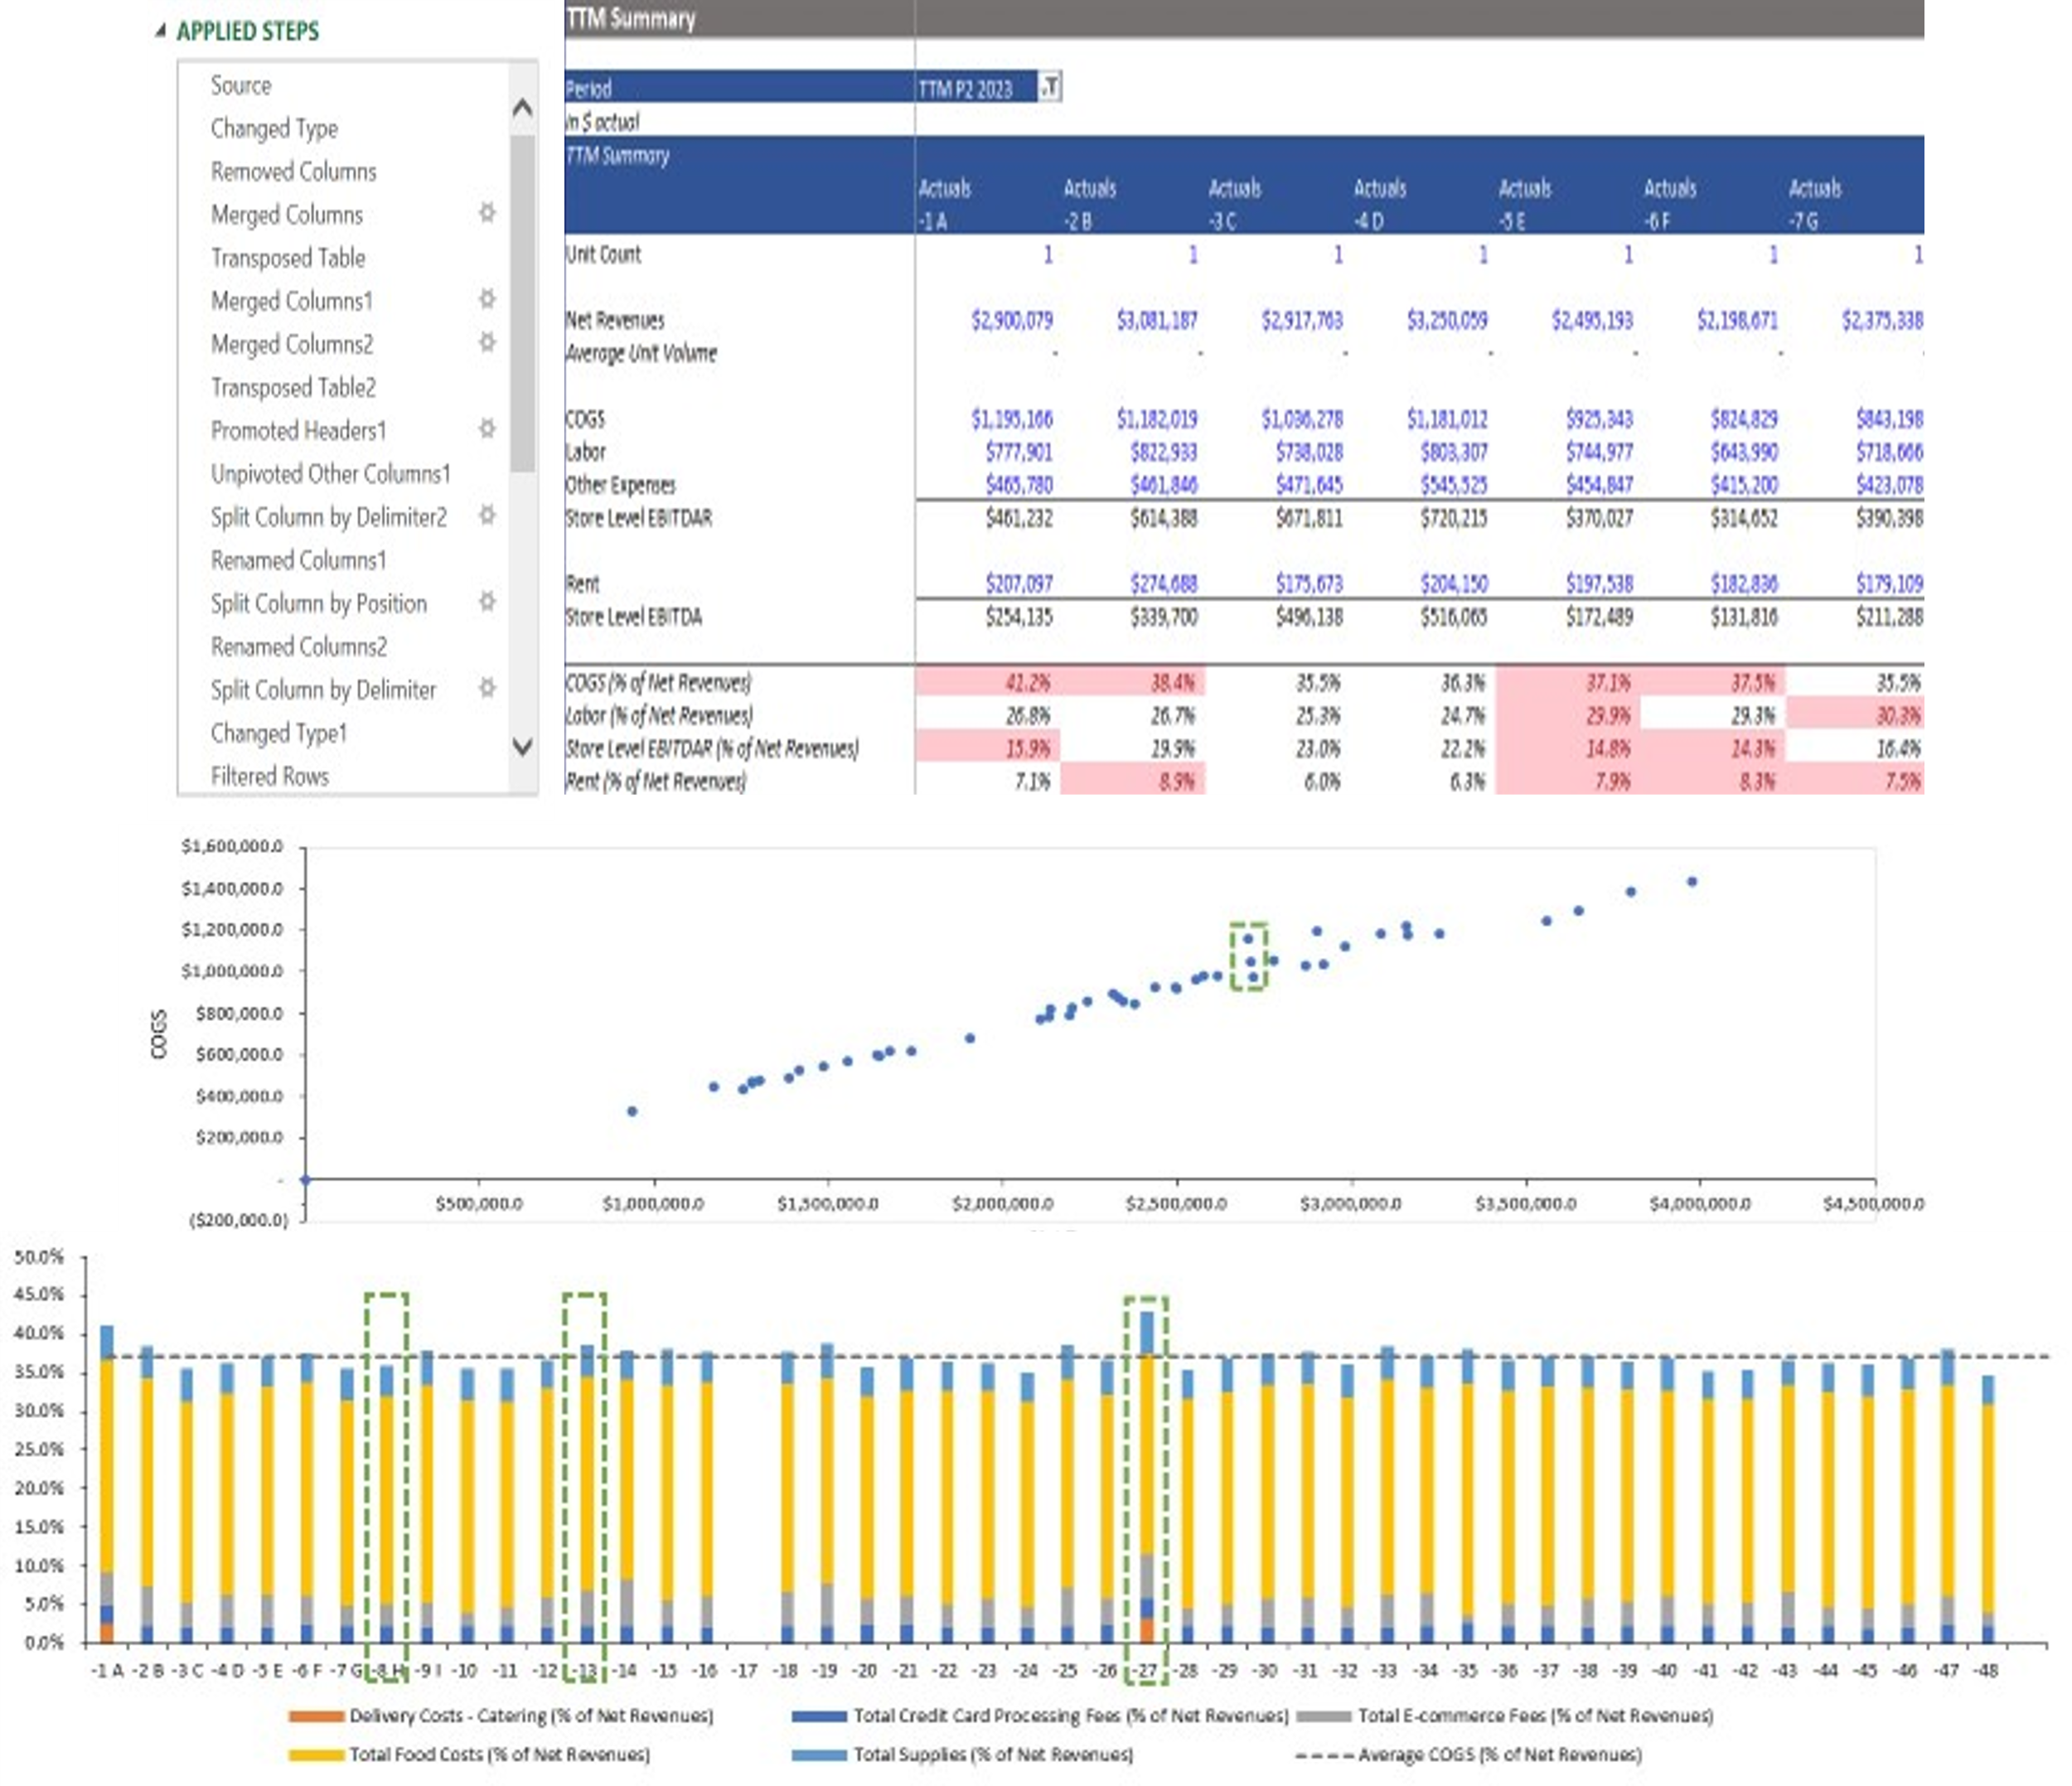
• Developed an interactive dashboard highlighting summarized financials and categorized expense analysis (COGS, Labor, Other) with sub-categories for cross-sectional and time-series comparisons
• The final deliverable included monthly, and annual graphical presentation of Income Statement items for individual stores and the entire group
The Challenges We Overcame
The major hurdles faced by the TresVista team were:
• Complexity in analysis and reporting process caused by difficulty in managing and analyzing dynamic store count
• Comprehensive breakdown of expense components was required to identify key drivers and improve graphical illustrations across stores
• Refining dashboard and develop a dynamic model with reduced dependency on complex formulas
• Establishing a structure that provides seamless data updation and maintenance
The team overcame these hurdles by developing a flexible data management system that could manage varying inputs and automate store updates using Power Query to manage the dynamic store count complexity. For the comprehensive expense breakdown, In-depth analysis of various data visualization approaches was conducted to identify key drivers for graphical enhancements. To establish seamless data updating and maintenance, an efficient data integration process was implemented, using data tables edited by Power Query and Pivot Table functionalities to enable real-time data feeds and regular maintenance schedules.
Final Product
The Value Add – Catalyzing the Client’s Impact
The TresVista team had the primary focus of providing the client with a highly optimized version of the dashboard they require. The dashboard was made in a way that it provided a consolidated view of store performance allowing for easy comparison and identification of trends. Data flow structure was made highly dynamic so that it helped in streamlining the process of monthly updates and reduced manual efforts, saving time for both client and the team. Lastly the visualizations were selected and presented in a way that provided valuable insights for the client to drive growth and efficiency across all aspects of their business.