The client, a global Investment Holding company, which manages various portfolio companies, used to manually update the company’s financial model’s tabs using the input files, which was time-consuming. Additionally, monthly data was evaluated in silos without leveraging historical data resulting in a considerable gap while obtaining deeper insights. The client wanted the TresVista Team to remove these impediments and create an interactive dashboard populated with historical data that uncovered deeper insights and allowed them to interact with the data the way they wanted.
To automate the manual task of operating model update for each of the client’s portfolio companies and create an interactive dashboard populated with historical data that uncovers deeper insights.
The TresVista Team executed the deliverable by dividing the task into three major components:
The major hurdles faced by the TresVista Team were:
The TresVista Team overcame these hurdles by creating a custom data transformation pipeline for the different file types, enabling the Python automation tool to identify the file type and name of the input file and perform the necessary operations. After communicating with the client, the code was adjusted to accommodate the structural changes. The team maintained clear lines of communication with the portfolio managers to resolve the hurdle of stakeholder management.
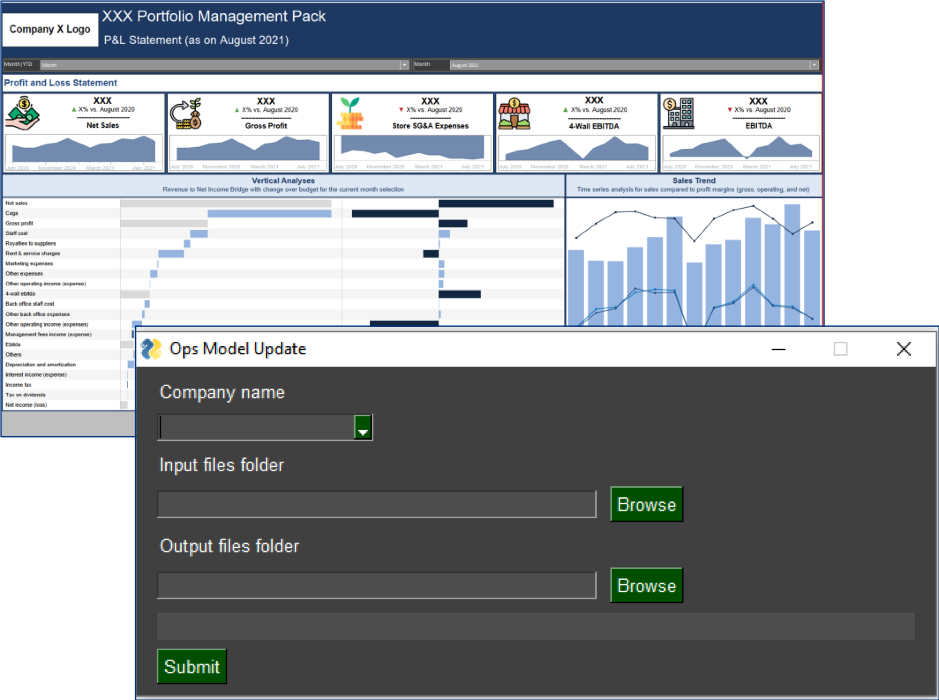
The TresVista Team created additional visualizations and KPIs which the client could use to generate insights like a year-on-year waterfall bridge, geospatial visualization, and trend analysis. The team incorporated a functionality of comments addition in the dashboard to allow the client to view historical comments, which they used to add to track line items of interest.